
Something that has struck me funny recently surrounds the traditional notion of availability of web applications. With respect to its relationship to revenue, to infrastructure and application behavior, and fault protection and tolerance, I’m thinking it may be time to get a broader upgrade adjustment to the industry’s perception on the topic.
These nuances in the definition and affects of availability aren’t groundbreaking. They’ve been spoken about before, but for some reason I’m not yet convinced that they’re widely known or understood.
Impact On Business
What is laid out here in this article is something that’s been parroted for decades: downtime costs companies money, and lost value. Generally speaking, this is obviously correct, and by all means you should strive to design and operate your site with high availability and fault tolerance in mind.
But underneath the binary idea that uptime = good and downtime = bad, the reality is that there’s a lot more detail that deserves exploring.
This irritatingly-designed site has a post about a common equation to help those that are arithmetically challenged:
| LOST REVENUE | = | (GR/TH) x I x H |
| GR | = | gross yearly revenue |
| TH | = | total yearly business hours |
| I | = | percentage impact |
| H | = | number of hours of outage |
In my mind, this is an unnecessarily blunt measure. I see the intention behind this approach, because it’s not meant to be anywhere close to being accurate. But modern web operations is now a field where gathering metrics in the hundreds of thousands per second is becoming more common-place, fault-tolerance/protection is a thing we do increasingly well, and graceful degradation techniques are the norm.
In other words: there are a lot more considerations than outage minutes = lost revenue, even if you did have a decent way to calculate it (which, you don’t). Companies selling monitoring and provisioning services will want you to subscribe to this notion.
We can do better than this blunt measure, and I thought it’s worth digging in a bit deeper.
“Loss”
Thought experiment: if Amazon.com has a full and global outage for 30 minutes, how much revenue did it “lose”? Using the above rough equation, you can certainly come up with a number, let’s say N million dollars. But how accurate is N, really? Discussions that surround revenue loss are normally designed to motivate organizations to invest in availability efforts, so N only needs to be big and scary enough to provide that motivation. So let’s just say that goal has been achieved: you’re convinced! Availability is important, and you’re a firm believer that You Own Your Own Availability.
Outside of the “let this big number N convince you to invest in availability efforts” I have some questions that surround N:
- How many potential customers did Amazon.com lose forever, during that outage? Meaning: they tried to get to Amazon.com, with some nonzero intent/probability of buying something, found it to be offline, and will never return there again, for reasons of impatience, loss of confidence, the fact that it was an impulse-to-buy click whose time has passed, etc.
- How much revenue did Amazon lose during that 30 minute window, versus how the revenue that it simply postponed when it was down, only to be executed later? In other words: upon finding the site down, they’ll return sometime later to do what they originally intended, which may or may not include buying something or participate in some other valuable activity.
- How much did that 30 minutes of downtime affect the strength of the Amazon brand, in a way that could be viewed as revenue-affecting? Meaning: are users and potential users now swayed to having less confidence in Amazon because they came to the site only to be disappointed that it’s down, enough to consider alternatives the next time they would attempt to go to the site in the future?
I don’t know the answers to these questions about Amazon, but I do know that at Etsy, those answers depend on some variables:
- the type of outage or degradation (more on that in a minute),
- the time of day/week/year
- how we actually calculate/forecast how those metrics would have behaved during the outage
So, let’s crack those open a bit, and see what might be inside…
Temporal Concerns
Not all time periods can be considered equal when it comes to availability, and the idea of lost revenue. For commerce sites (or really any site whose usage varies with some seasonality) this is hopefully glaringly obvious. In other words:
X minutes of full downtime during the peak hour of the peak day of the year can be worlds apart from Y minutes of full downtime during the lowest hour of the lowest day of the year, traffic-wise.
Take for example a full outage that happens during a period of the peak day of the year, and contrast it with one that happens during a lower-period of the year. Let’s say that this graph of purchases is of those 24-hour periods, indicating when the outages happen:
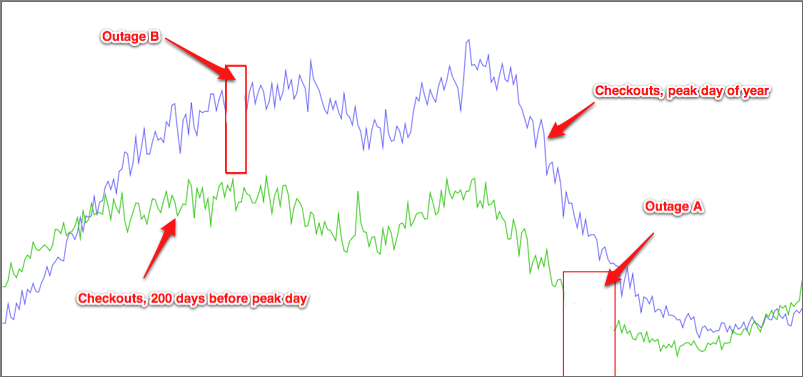
The impact time of the outage during the lower-traffic day is actually longer than the peak day, affecting the precious Nines math by a decent margin. But yet: which outage would you rather have, if you had to have one of those? 🙂
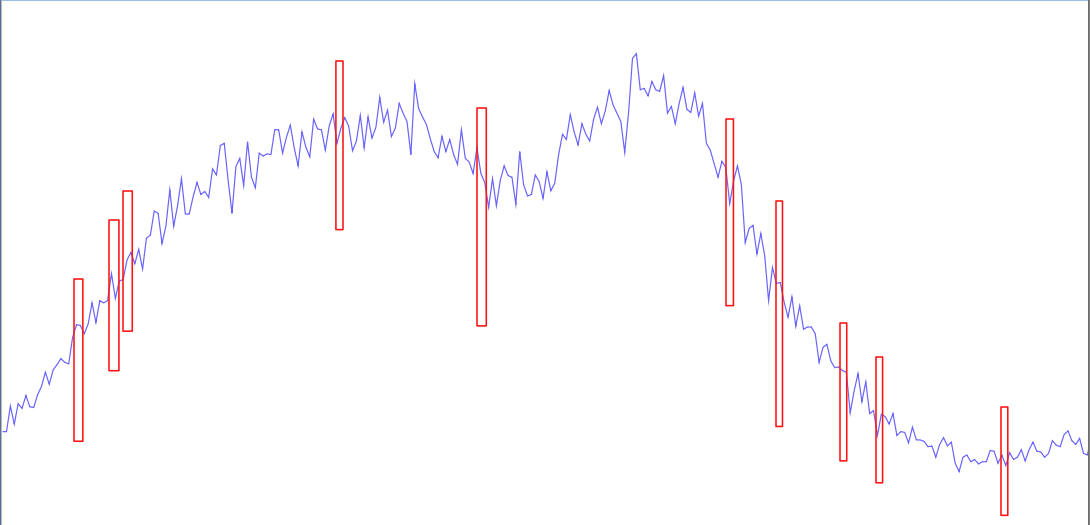
Another temporal concern is: across space and time, distribution and volume of any level degradation could be viewed as perfect uptime as the length of the outage approaches zero.
Dig, if you will, these two outage profiles, across a 24-hour period. The first one has many small outages across the day:
and the other has the same amount of impact time, in a single go:
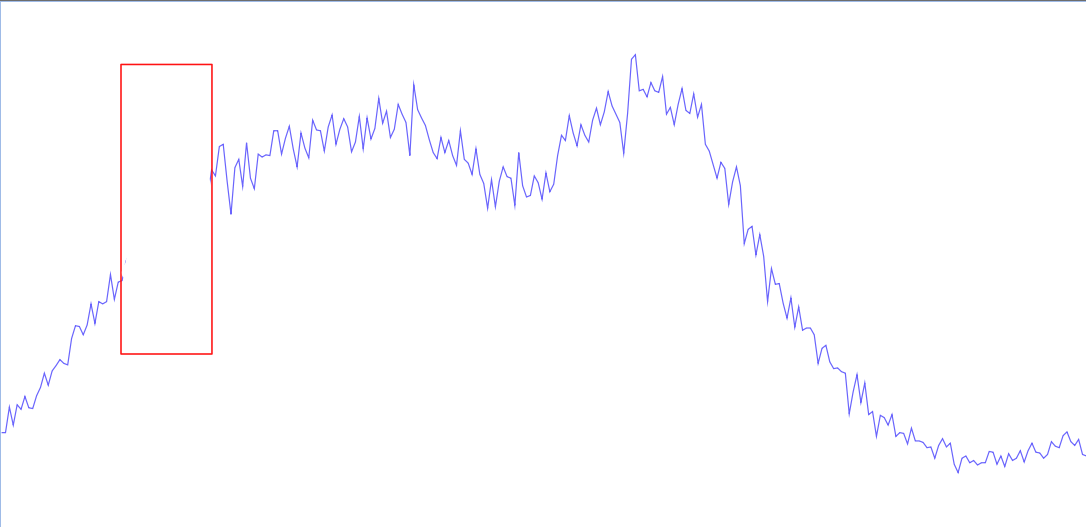
So here we have the same amount of time, but spread out throughout the day. Hopefully, folks will think a bit more beyond the clear “they’re both bad! don’t have outages!” and could investigate how they could be different. Some considerations in this simplified example:
- Hour of day. Note that the single large outage is “earlier” in the day. Maybe this will affect EU or other non-US users more broadly, depending on the timezone of the original graph. Do EU users have a different expectation or tolerance for outages in a US-based company’s website?
- Which outage scenario has a greater affect on the user population: if the ‘normal’ behavior is “get in, buy your thing, and get out” quickly, I could see the many-small-outages more preferable to the single large one. If the status quo is some mix of searching, browsing, favoriting/sharing, and then purchase, I could see the singular constrained outage being preferable.
Regardless, this underscores the idea that not all outages are created equal with respect to impact timing.
Performance
Loss of “availability” can also be seen as an extreme loss of performance. At a particular threshold, given the type of feedback to the user (a fast-failed 404 or browser error, versus a hanging white page and spinning “loading…”) the severity of an event being slow can effectively be the same as a full outage.
Some concerns/thought exercises around this:
- Where is this latency threshold for your site, for the functionality that is critical for the business?
- Is this threshold a cliff, or is it a continuous/predictable relationship between performance and abandonment?
There’s been much more work on performance’s effects on revenue than availability. The Velocity Conference in 2009 brought the first real production-scale numbers (in the form of a Bing/Google joint presentation as well as Shopzilla and Mozilla talks) behind how performance affects businesses, and if you haven’t read about it, please do.
Graceful Degradation
Will Amazon (or Etsy) lose sales if all or a portion of its functionality is gone (or sufficiently slow) for a period of time? Almost certainly. But that question is somewhat boring without further detail.
In many cases, modern web sites don’t simply live in a “everything works perfectly” or “nothing works at all” boolean world. (To be sure, neither does the Internet as a whole.) Instead, fault-tolerance and resilience approaches allow for features and operations degrade under a spectrum of failure conditions. Many companies build their applications to have both in-flight fault tolerance to degrade the experience in the face of singular failures, as well as making use of “feature flags” (Martin and Jez call them “feature toggles“) which allow for specific features to be shut off if they’re causing problems.
I’m hoping that most organizations are familiar with this approach at this point. Just because user registration is broken at the moment, you don’t want to prevent already logged-in users from using the otherwise healthy site, do you? 🙂
But these graceful degradation approaches further complicates the notion of availability, as well as its impact on the business as a whole.
For example: if Etsy’s favoriting feature is not working (because the site’s architecture allows it to gracefully fail without affecting other critical functionality), but checkout is working fine…what is the result? Certainly you might paused before marking down your blunt Nines record.
You might also think: “so what? as long as people can buy things, then favoriting listings on the site shouldn’t be considered in scope of availability.”
But consider these possibilities:
- What if Favoriting listings was a significant driver of conversions?
- If Favoriting was a behavior that led to conversions at a rate of X%, what value should X be before ‘availability’ ought to be influenced by such a degradation?
- What if Favoriting was technically working, but was severely degraded (see above) in performance?
Availability can be a useful metric, but when abused as a silver bullet to inform or even dictate architectural, business priority, and product decisions, there’s a real danger of oversimplifying what are really nuanced concerns.
Bounce-Back and Postponement
As I mentioned above, what is more likely for sites that have an established community or brand, outages (even full ones) don’t mark an instantaneous amount of ‘lost’ revenue or activity. For a nonzero amount, they’re simply postponed. This is the area that I think could use a lot more data and research in the industry, much in the same way that latency/conversion relationship has been investigated.
The over-simplified scenario involves something that looks like this. Instead of the blunt math of “X minutes of downtime = Y dollars of lost revenue”, we can be a bit more accurate, if we tried just a bit harder. The red is the outage:
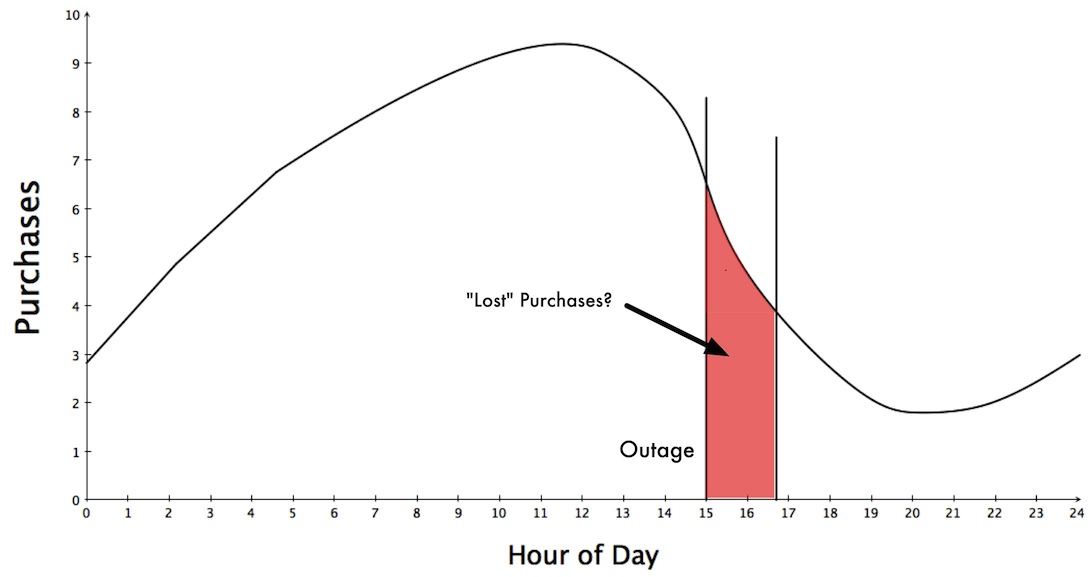
So we have some more detail, which is that if we can make a reasonable forecast about what purchases did during the time of the outage, then we could make a better-inform estimate of purchases “lost” during that time period.
But is that actually the case?
What we see at Etsy is something different, a bit more like this:
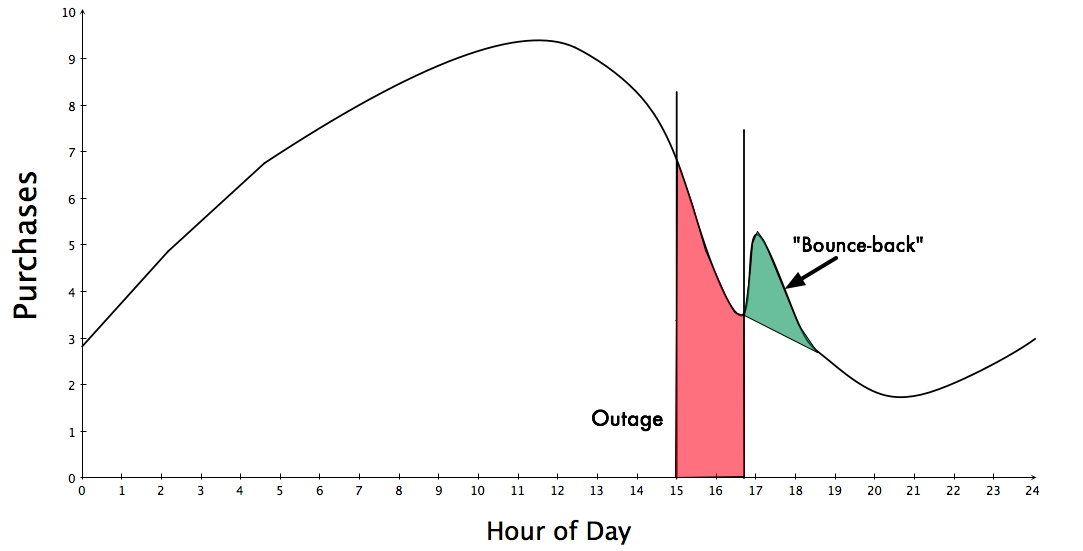
Clearly this is an oversimplification, but I think the general behavior comes across. When a site comes back from a full outage, there is an increase in the amount of activity as users who were stalled/paused in their behavior by the outage resumes. My assumption is that many organizations see this behavior, but it’s just not being talked about publicly.
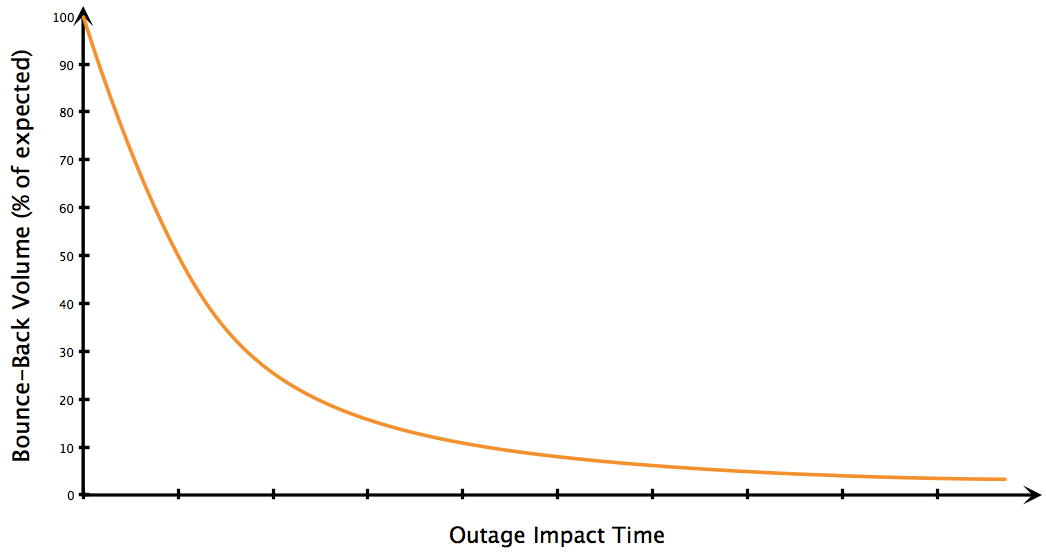
The phenomenon that needs more real-world data is to support (or deny) the hypothesis that depending on:
- Position of the outage in the daily traffic profile (start-end)
- Position of the outage in the yearly season
the bounce-back volume will vary in a reasonably predictable fashion. Namely, as the length of the outage grows, the amount of bounce-back volume shrinks:
What this line of thinking doesn’t capture is how many of those users postponed their activity not for immediately after the outage, but maybe the next day because they needed to leave their computer for a meeting at work, or leaving work to commute home?
Intention isn’t entirely straightforward to figure out, but in the cases where you have a ‘fail-over’ page that many CDNs will provide when the origin servers aren’t available, you can get some more detail about what requests (add to cart? submit payment?) came in during that time.
Regardless, availability and its affect on business metrics isn’t as easy as service providers and monitoring-as-a-service companies will have you believe. To be sure, a good amount of this investigation will vary wildly from company to company, but I think it’s well worth taking a look into.
Nice post, John. When I’ve been out in the field working with customers to help them better understand what they can do to improve their operations stance, I usually walk them through something similar to what you’ve posted here. The “giant hammer” number of “how much revenue do you loose in an outage” is almost always useful in that scenario, for two reasons:
1. The operations team almost never knows the revenue numbers. Just by asking the question, they go find out.
2. The number is, in almost all cases in my experience, actually *lower* than they thought it would be. The amount of stress induced by the idea of millions of dollars a minute leaking away, versus the reality (thousands at best, most of the time) is often stark.
We then usually have the conversation around why the metric is useful to know, followed by all the ways in which it falls woefully short of a full understanding of outage impact (timing, bounce back, etc.). I’ve discovered that if I start with the full-understanding discussion, people get emotional quickly – the pile of unknowns adds up so fast, it’s easier to just fall back to your emotional starting position. So walking people through the first equation, then dropping the fullness of the science, seems to help them get to a place where the nuance can be discussed with way less fear.
The outcome is almost always great – the focus on 0 tolerance for outages (still a very common corporate theme) gets levered away pretty quickly by the raw number, and the nuanced understanding of the metric tends to make the raw number look even better (further entrenching the correct stance in the face of potential opposition.)
Love,
Adam
Adam – that sounds like the sensible and reasonable approach to take with orgs not fully comfortable with the idea of failure in general. As usual, thanks for the insightful comment. 🙂
Indeed John, everything fails.
Failure is not bad or good, it just is. It happens in all systems.
Failure has a lot of good points as well that we tend to forget.
Failures inspire evolution, innovation and yes when *-{east,west}.* tanks – stress, but also creativity.
Downtime generally makes us better in some way. If we never failed, we would never have to improve, adapt and change. Ironically failure is probably the one thing that drives resilient practices and strategy in a business more than anything else.
Excellent deep dive into the subject in a way that can help justify organizational initiatives to result in higher availability.
I would like to encourage a follow-on post from you describing the architectural options we have for implementing this at various price points and scales. I’ve spent a few hours trying to synthesize from info I get in web searches for “failover” and “high-availability” a coherent hierarchy of choices here, but seem to hit a wall of vendor propriety or lengthy fine-grained DIY technology approaches described.
I’ve observed a case where a rare outage produces lots of related chatter on social networks, driving more traffic to the site when it is revived. There’s a sort of advertising effect that can take place with the right kind of company that can outweigh the costs of the outage. Treat your customers kindly and they will be nicer to you during and after an outage.
Pingback: Sysadmin Sunday 111 - Server Density Blog
Nice work John. This is my second SMTP based company running ops. Postini and SendGrid. Availability gets even stranger when you have machines vs people talking to each and when you have specific measures in a protocol to handle failures. Multi MX, etc., etc.
The trick for us, which we have yet to figure out, is since we send transactional email, how much delay should equal downtime? Does delayed mail ever equal downtime? What percentage of email and/or time of a single customer’s transactional email is downtime? Is it different for each customer? How many customers need to be impacted before it is downtime?
The board is asking for a number of nines impact report when a proxy server goes down. For example, we had one which delayed email for 30 minutes for 0.00007 of monthly email. It was still half a million messages, we just send a lot. If you tell someone “Hey, we delayed half a million messages for 30 minutes”, that sounds bad. “We delayed 0.00007 of our monthly email for 30 minutes”, who cares right?
I am still searching for a way to manage the balance of what type of downtime should impact the organization enough to cause change to remedy, vs an acceptable level of customer impact that should be tracked over time, or finally just the number of nuisances that the company has to endure from tech-debt incurred but architected around.
Anyway, that’s just our specific product. Thanks for the write-up. It should help our mgmt team understand that it isn’t as simple as a number of nines.
Jon: thanks for the comment. Indeed, I can see how it’d be even more convoluted to define and measure availability and impact of disruption when the components and the product are so inherently asynchronous. Oy.
Pingback: Building an app on Heroku? Here is a production-ready checklist. | Not waving but drowning
Pingback: Recommended Reading: John Allspaw | Joseph Scott
Pingback: Refresher Course in Automation Economics | VMware CloudOps - VMware Blogs
Pingback: How to Calculate the Economic Cost of an Outage | teamdevops.com
Pingback: The Importance of Observability - Server Fault Blog
Pingback: The Importance of Observability - DL-UAT
Pingback: The Importance of Observability | CL-UAT
Pingback: Surprising Database Bottlenecks You’ll Never See Coming | InsideMySQL
Pingback: Surprising Database Bottlenecks You'll Never See Coming | MySQL
Pingback: The Impact of Performance on Revenue | Ecommerce Performance Issues
Pingback: The Impact of Performance on Revenue - Actionable Insights